The paintr package (GitHub, documentation) draws pictures of R data structures for teaching: vectors, matrices, data frames, lists, and arrays. Its one trick is that on each cell it writes the expression you would type to reach that value. The label on the third box of a vector is [3], because x[3] is how you pull it out; the label in a matrix cell is [2, 4], because that is m[2, 4]. The drawing and the accessor are the same object.
The full case for why that matters, and a proper tour of all five structures, is in the companion post, You Can’t Index What You Can’t Picture. This note is the short version: what version 0.0.1 ships, and how to get it.
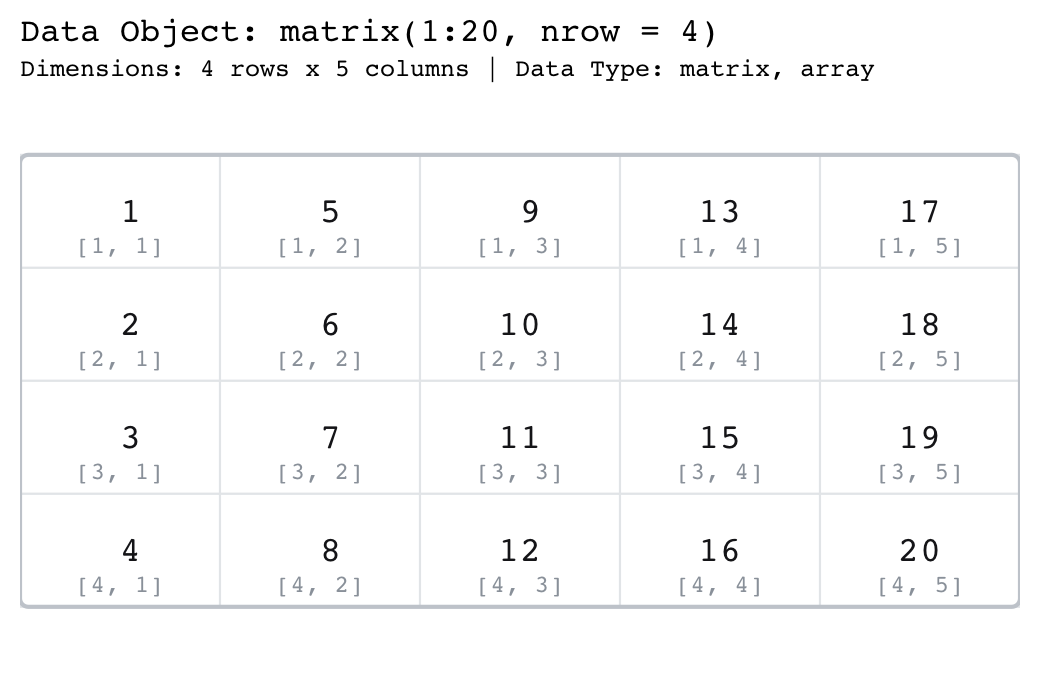
show_indices = "cell": every square carries its own [row, column] subscript, so m[2, 4] stops being an incantation and becomes the cell you can point at.A quick tour
Every structure has a painter, and each paint_*() function draws to the base graphics device. Each has a gpaint_*() twin that returns a real ggplot object you can print, ggsave(), or drop into a patchwork. Same picture, either way.
library(paintr)

paint_vector(c(mon = 1, tue = 2, wed = 3))                     # cells labelled ["mon"], not a bare mon
paint_matrix(matrix(1:20, nrow = 4), show_indices = "cell")    # a [row, column] subscript in each cell
paint_data_frame(mtcars)                                       # column names, a type band, a row-name gutter
paint_list(list(a = 1:3, b = 4:6))                             # a list drawn like the data frame it could be
paint_array(array(1:24, dim = c(2, 3, 4)), slices_per_row = 2) # an array as a stack of matrices
The pictures are built to stay readable. Numbers show at three significant figures with the trailing digits greyed rather than dropped, colour carries meaning (red NA, blue Inf and NaN), large structures elide their middle with a # 130 more rows note, and highlighting shades the cells you name. The news entry below has the specifics.
New in 0.0.1: a palette and a refined look
The most visible change is the look itself. Every painter now takes a palette argument. The three modern palettes, "mint" (the new default), "slate", and "warm", share a refined card: a tinted header band, bold column names over lighter type tags, hairline borders instead of a hard black grid, and softly rounded corners. "classic" keeps the original flat black-grid look, byte-for-byte. Both backends draw the card identically, because the style rides along as data on the cell table.
paint_data_frame(mtcars, palette = "mint")     # the new default
paint_data_frame(mtcars, palette = "classic")  # the original black-grid look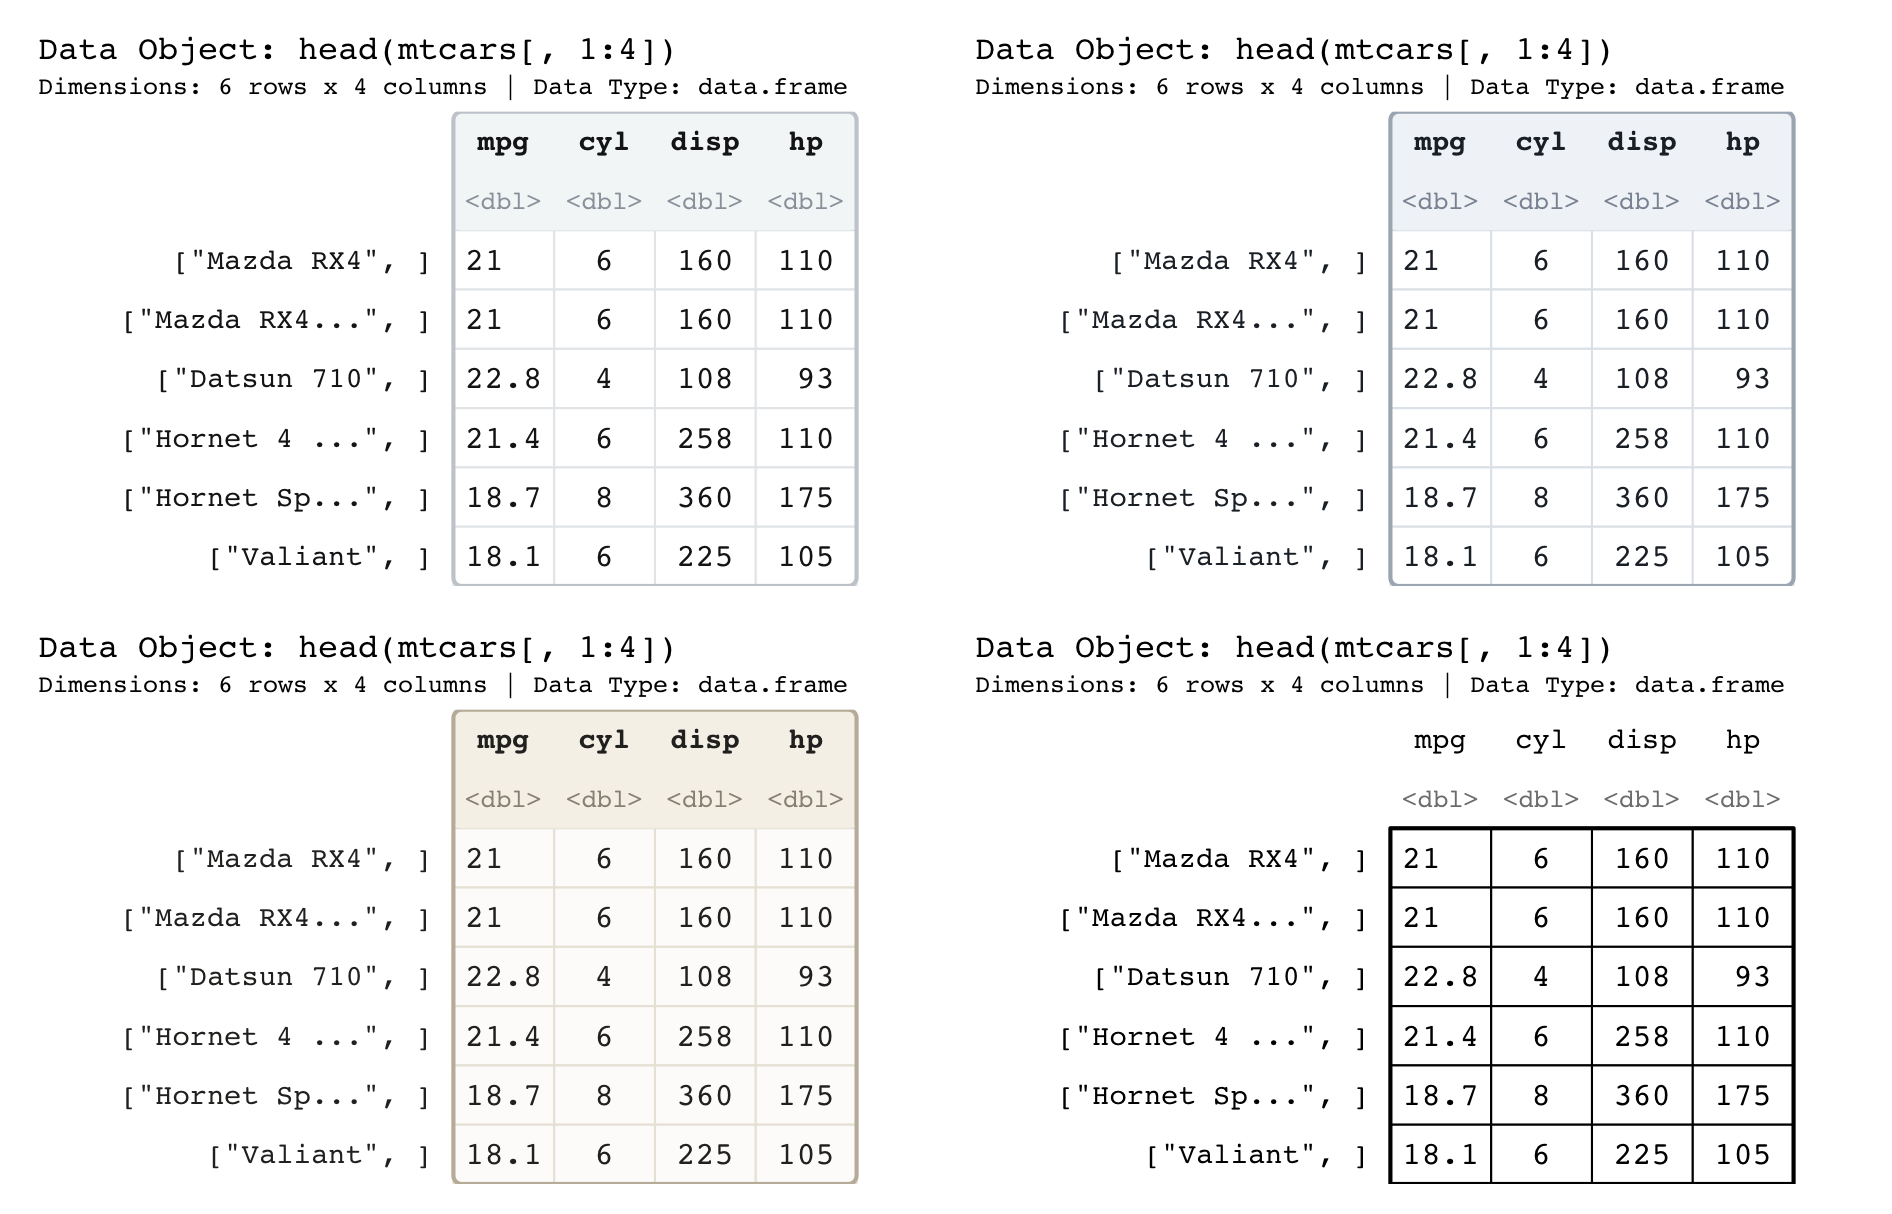
"mint", "slate", and "warm" share the refined card (tinted header, hairline borders, rounded corners), while "classic" keeps the original flat black grid.One more small utility rounds out the release. paint_size() tells you the device size a structure needs to stay legible, in inches, centimetres, or pixels, and it opens no device to work it out, so it answers before you have one that is too small. Paste the answer straight into a png() call or a knitr chunk header:
paint_size(mtcars)
#> width height
#>   4.4   2.4
Installation
paintr is headed to CRAN: version 0.0.1 has been submitted and is working its way through review. In the meantime, install the development version from GitHub:
# install.packages("pak")
pak::pak("coatless-rpkg/paintr")
Once it clears CRAN, the release version will install the usual way:
install.packages("paintr")A note on the name: paintr was developed under the name drawr, but CRAN does not allow two package names that differ only in case, and DRaWR already held that spot, so it was renamed.
For the complete set of changes, see the paintr news file entry below, or the full commit history for this release on GitHub.
paintr news file entry for version 0.0.1
Initial CRAN submission. The package was previously developed as drawr.
Breaking changes
- Numbers draw at three significant figures by default, tunable with
sigfig. - Large matrices, vectors, and data frames elide their middle past a size cap, overridable with
max_rows,max_cols, orshow_all = TRUE. - A data frame’s list column shows each element’s type and size, like
<int [3]>, instead of a bare<list>.
New features
paint_list()andgpaint_list()draw a list, each element a column and its values the rows, which is the picture a data frame makes once its columns share a length.show_indices = "cell"labels cells with the[[j]][i]accessor, andsummarise = TRUEcollapses each element to a single cell.- Named vectors, matrix
dimnames(), and data-frame row names are drawn as labels, toggled withshow_names,show_dimnames, andshow_rownames. paint_data_frame()andgpaint_data_frame()(aliasespaint_df()andgpaint_df()) draw a data frame with a per-column type band, controlled byshow_namesandshow_types.gpaint_vector()completes thepaint_*()andgpaint_*()pairing for every structure.paint_size()returns the device size a structure needs to stay legible, in inches, centimetres, or pixels.- Cell text is fitted to the available space so it no longer overflows, with
fontsizeandfamilyto override. - Insignificant trailing digits are greyed rather than dropped, tunable with
subtle_digits. - Long strings are truncated to
max_charswith an ellipsis.
Bug fixes
- Character matrices and vectors render their values instead of a red
Unknown. highlight_data()and thehighlight_rows(),highlight_columns(), andhighlight_locations()helpers no longer error on character vectors, logical vectors, or data frames, and accept row and column names.- Graphics parameters are restored after
paint_matrix()andpaint_vector(). paint_matrix()’s type error no longer claims the data should be avector.
References
Every external link used above, gathered in one place: